Generating Reports
How to create and download reports on program activity
Mentorship programs that can't demonstrate results eventually lose funding, executive support, or both. Reports turn your program's activity into the kind of evidence that leadership and stakeholders need: concrete numbers on participation, engagement, and goal completion. Regular reporting isn't just administrative overhead; it's how you protect and grow your program's investment. The Reports page lets you generate detailed reports for stakeholders, leadership, or compliance.
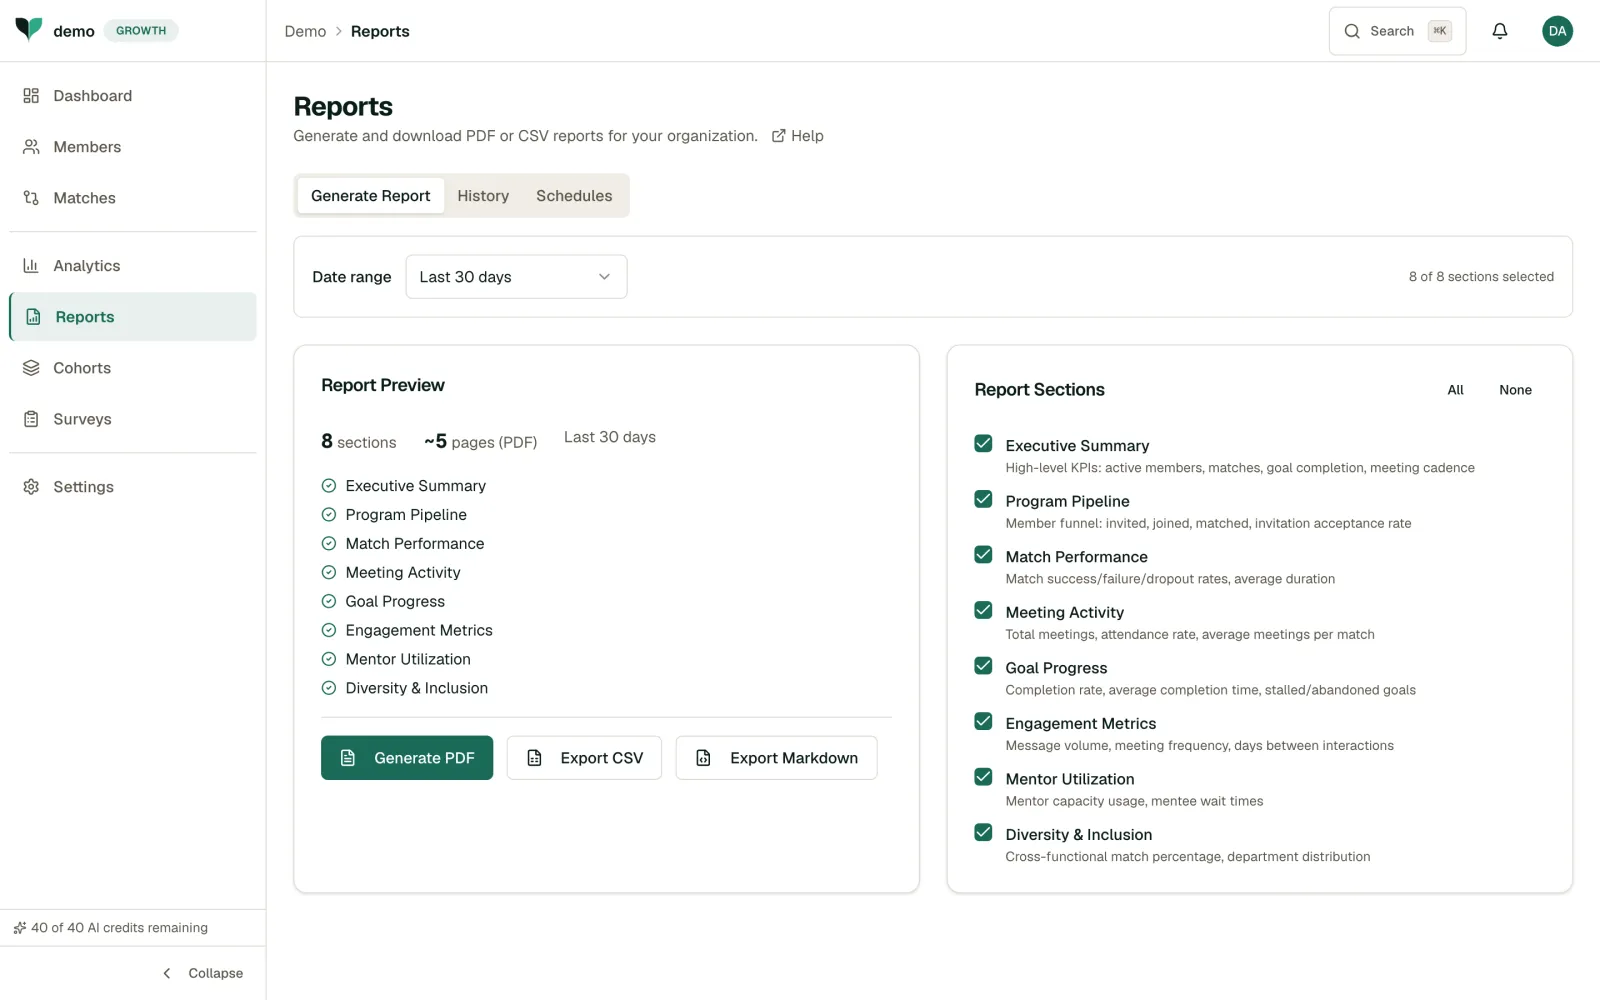
Report Sections
Reports are built from modular sections. Toggle each section on or off in the Report Sections panel on the right before generating:
- Executive Summary: High-level KPIs (active members, matches, goal completion, meeting cadence)
- Program Pipeline: Member funnel: invited, joined, matched, invitation acceptance rate
- Match Performance: Match success/failure/dropout rates, average duration
- Meeting Activity: Total meetings, attendance rate, average meetings per match
- Goal Progress: Completion rate, average completion time, stalled/abandoned goals
- Engagement Metrics: Message volume, meeting frequency, days between interactions
- Mentor Utilization: Mentor capacity usage, mentee wait times
- Diversity & Inclusion: Cross-functional match percentage, department distribution
Generating a Report
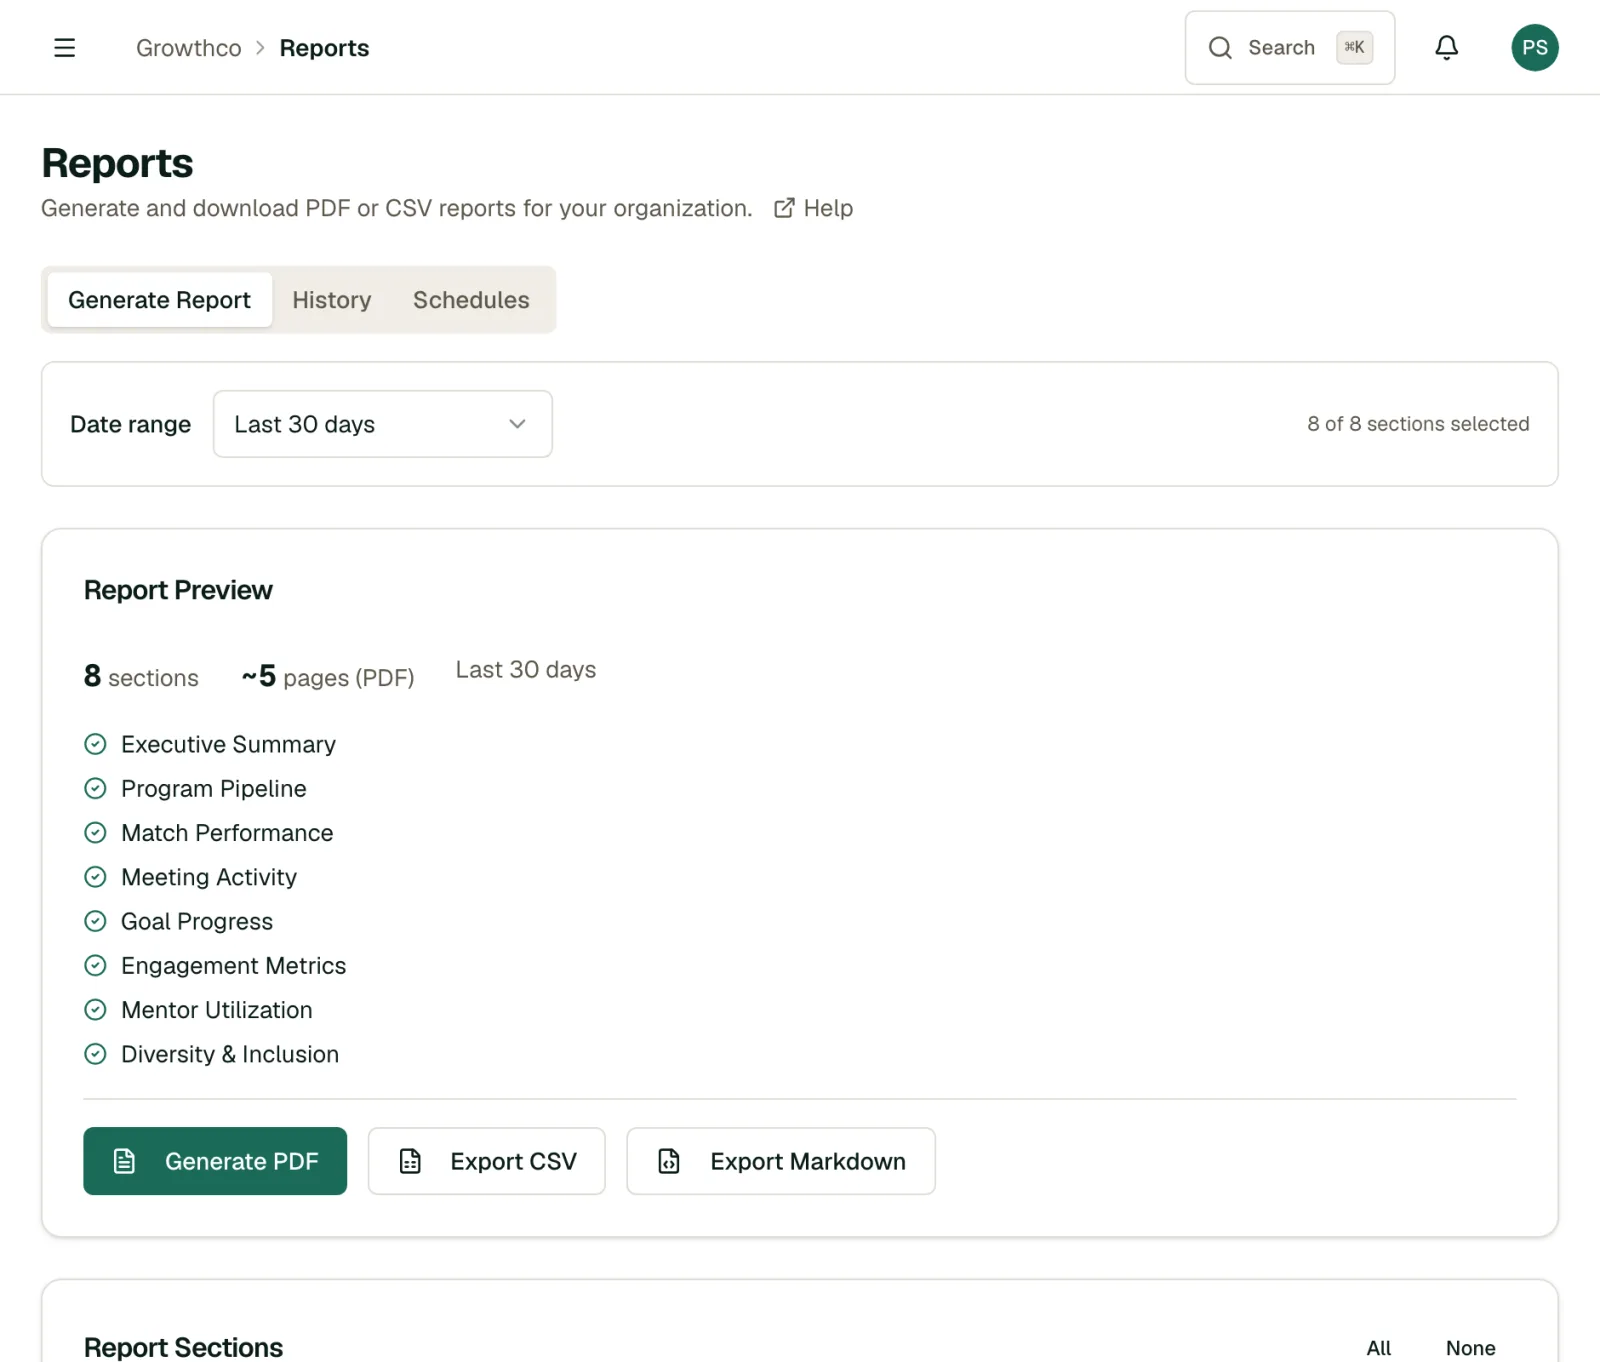
- Navigate to the Reports page and stay on the Generate Report tab.
- Choose a date range from the dropdown (e.g. Last 30 days).
- Toggle the Report Sections you want to include. The Report Preview updates in real time, showing section count and estimated page length.
- Click Generate PDF, Export CSV, or Export Markdown to download in your preferred format.
Scheduling Reports
On the Growth plan and above, use the Schedules tab to set up reports that generate automatically and land in inboxes on a recurring basis:
- Open the Schedules tab and click New Schedule.
- Give the schedule a Name (e.g. "Weekly Executive Summary").
- Choose a Frequency: Weekly or Monthly.
- Add one or more recipient emails (comma-separated).
- Save. The report is generated and emailed on that cadence until you delete the schedule.
Past reports are available under the History tab.
Note
Report generation is available on Starter and above; automated scheduling and custom report branding require Growth or above.
Tip
Use the CSV format if you need to do further analysis in a spreadsheet. PDF is better for sharing with non-technical stakeholders.
Getting the Most Out of Reports
- Set up a monthly reporting cadence. Scheduled monthly reports to your own inbox create accountability and make it easy to spot trends you'd miss otherwise.
- Lead with outcomes, not activity. Stakeholders care about goal completion rates and skill development, not how many messages were sent. Choose the report type that tells the outcome story.
- Compare across time periods. A single report is informational. Two reports side by side tell a story about whether your program is improving, flat, or declining.
- Pair reports with survey data. Quantitative reports show what happened; survey feedback explains why. Together, they give you a complete picture to present to leadership.